
Security Level In Power BI

Power BI 

Security Level In Power BI


There are 2 levels of security in Power BI


  1. Data level/Row-level security: Data is visible based on their login in a report. As per assigned roles only they view data in the report

  2. Access Level: The security is applied at the workplace/App level. It means managing security in the workspace by giving edit, view and browse..etc options for a workspace to members 


Row Level Security :


EX : 


→ Consider the situation where you need to restrict the data/row level at a country level. Let's see how to implement row-level security.


→ Creating roles based on the country column 


→ Next, go to the Modeling tab and click on Manage Roles


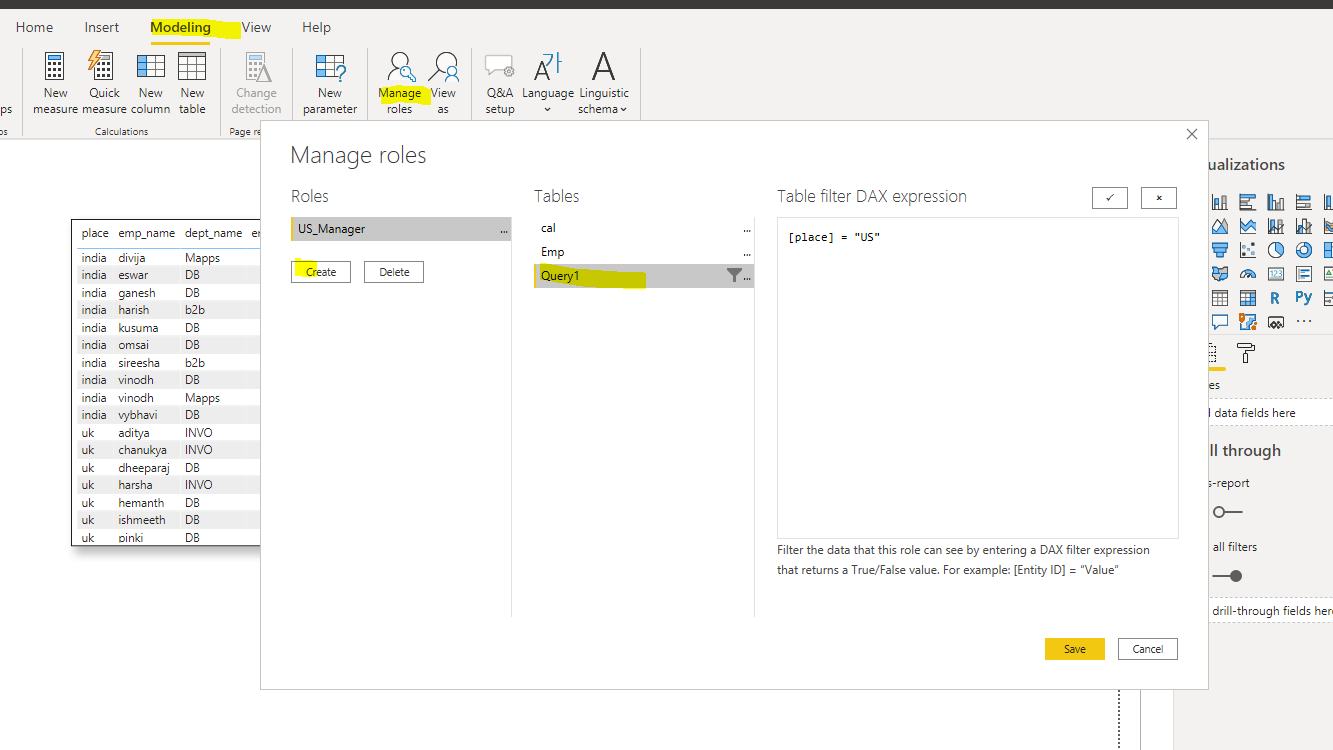
→ Click on Create a role - "Query1" and Select Place on Add Filter


→  Create a DAX Calculation  [place] = "US"


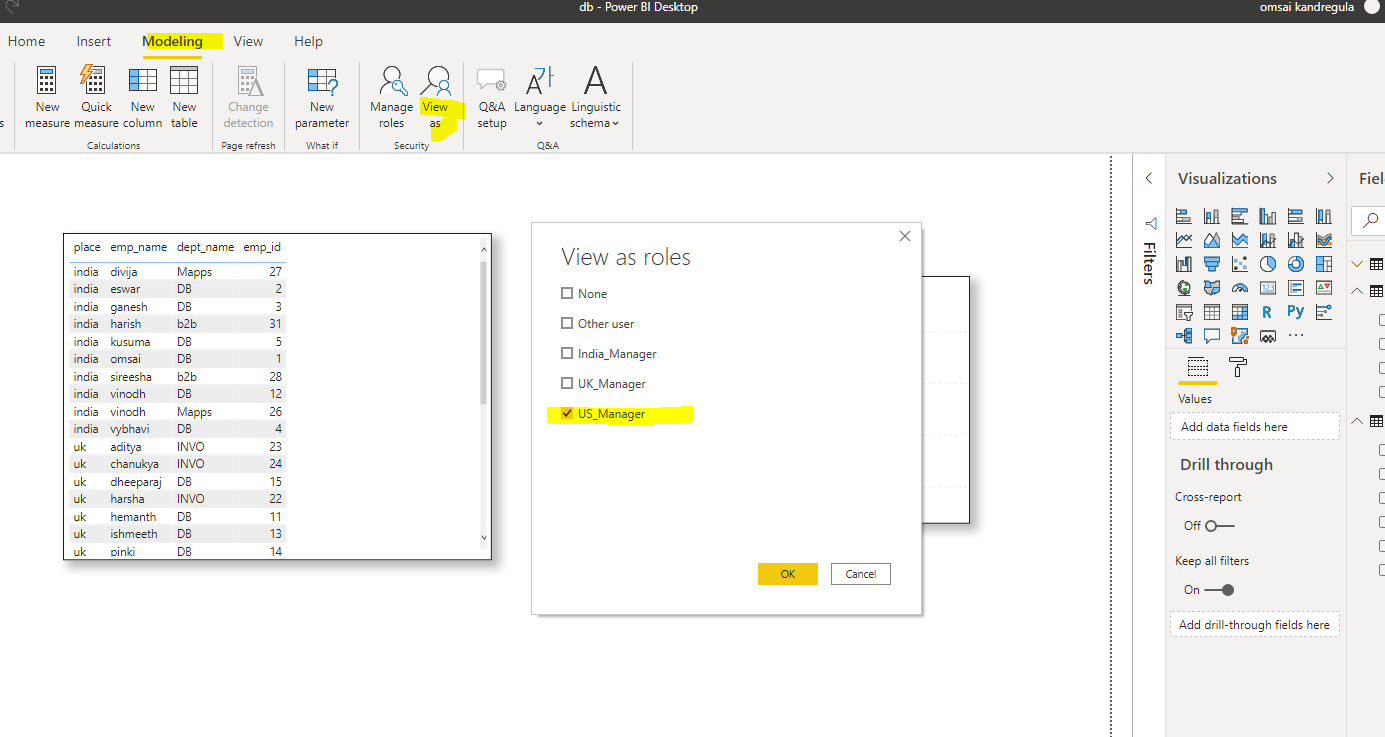
→  Similarly, create roles for US and INDIA countries.


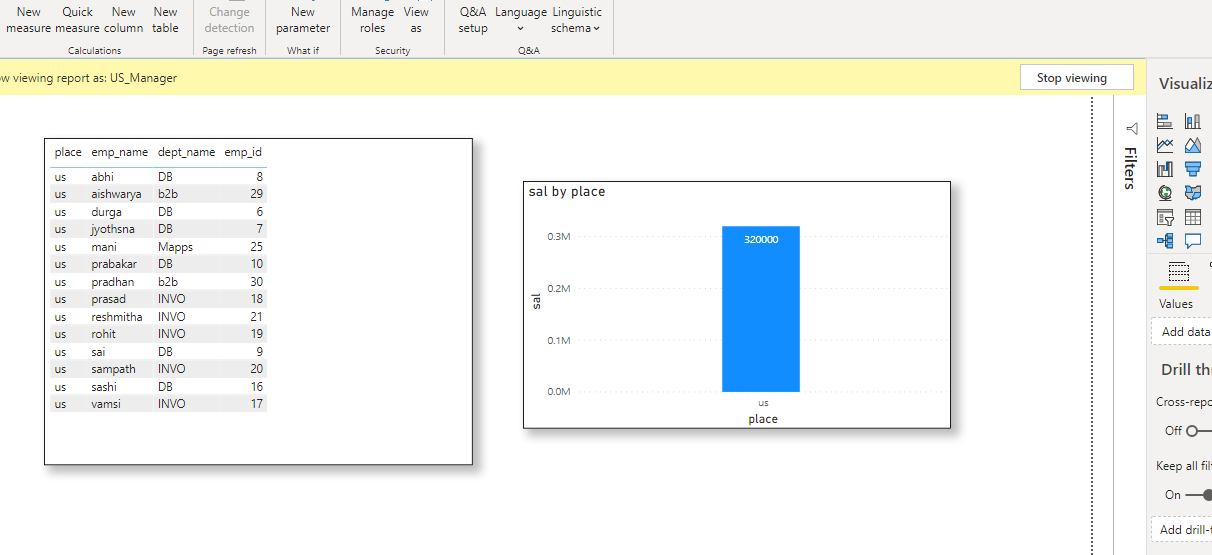
Now, Click on View as in modeling Tab


See Data filtering based on row-level security :


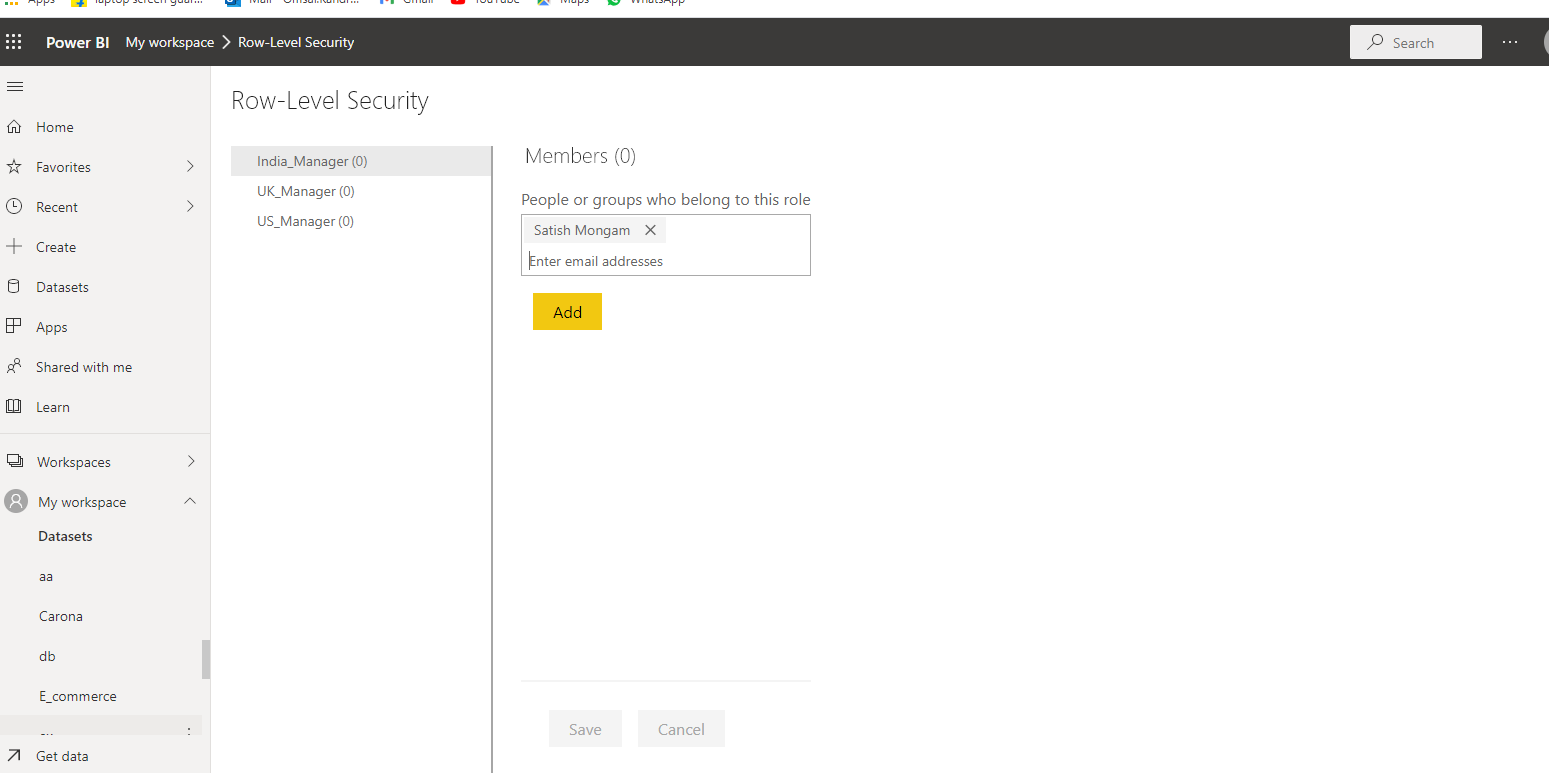
Assigning members to roles in Power BI Service:


Goto Security in datasets


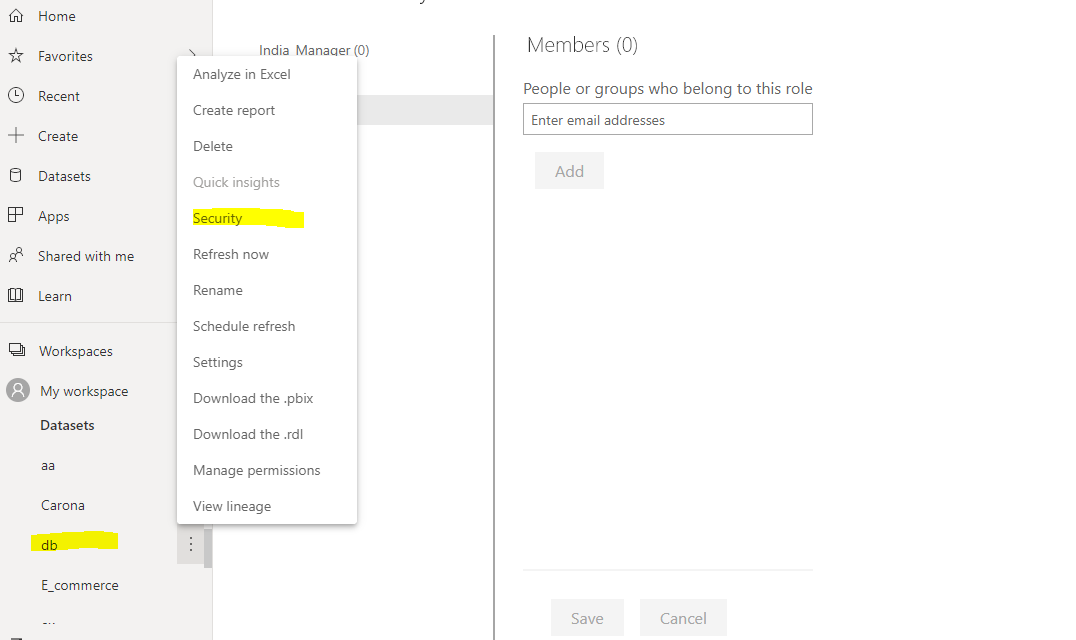
In Security you can add members to roles and test roles :


Once Add Roles Click On Save


Once they login into their service using their account. They can see only data as per role


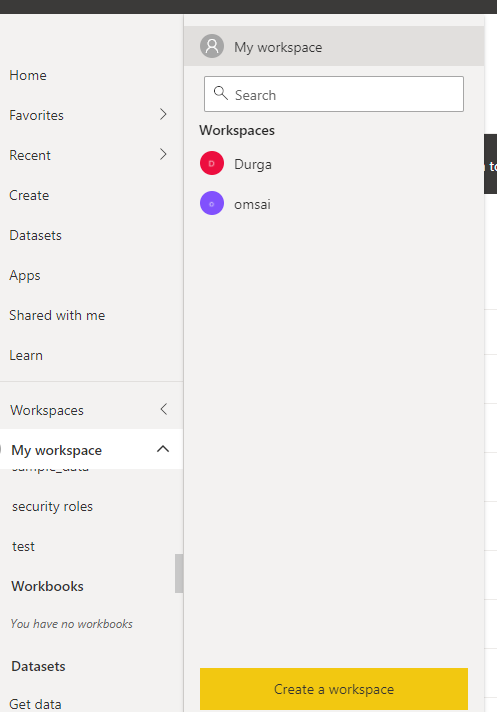
Create one of the new workspaces

In order to create a workspace in service, Need pro/ Premium Account

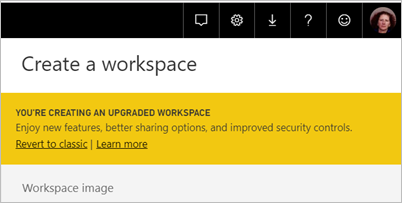
Start by creating the workspace. Select Workspaces > Create a workspace.


Screenshot of New workspace experience.

→ Give the workspace a unique name. If the name isn't available, edit it to come up with a unique name.
The app you create from the workspace will have the same name and icon as the workspace.

→ Here are some optional items you can set for your workspace:

 Upload a Workspace image. Files can be .png or .jpg format. File size has to be less than 45 KB.

Specify a Workspace OneDrive to use a Microsoft 365 group file storage location.

Add a Contact list. By default, the workspace admins are the contacts.

Allow contributors to update the app for the workspace

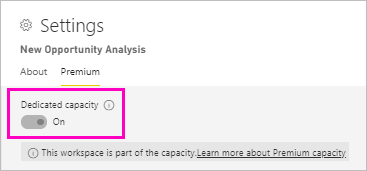
To assign the workspace to a Dedicated capacity, on the Premium tab select Dedicated capacity.
Screenshot of Dedicated capacity.

→ Select Save.
Power BI creates the workspace and opens it. You see it in the list of workspaces you’re a member of.

Give access to your workspace

Anyone who has an admin role in a workspace can give others access to the workspace by adding them to the different roles. Workspace creators are automatically admins. See Roles in the new workspaces for an explanation of the roles.

 Note

To enforce row-level security (RLS) for Power BI Pro users browsing content in a workspace, assign the users the Viewer Role. See Roles in the new workspaces for an explanation of the different roles.


Comments

Popular posts from this blog

Bookmarks and Buttons

Power BI   Bookmarks and Buttons Select some columns into a table : Copy Visual and Paste, change it to Bar Chart by selecting any one of the columns and overlap both visuals: Goto View → Enable selection Pane and Bookmark Pane In selection Pane, we Can hide and Display visuals Bookmarks helpful to display state of visualizations : Now, Create a bookmark : → Add Buttons   → Capture Visuvals by hiding required visuals  Now,  → Hide the Table and Off button create bookmark and capture bar chart Hide the bar chart and On Button, create bookmark and capture table Click on Bookmark1 and select the visible button and Enable action in the properties pane Type: Bookmark Bookmark: Bookmark2 Click on Bookmark2 and select the visible button and Enable action in the properties pane Type: Bookmark Bookmark: Bookmark1 Now, Ctrl+click on buttons to Capture Visuals

Difference Between Calculated Column And Measure

Power BI  Difference Between Calculated Column And Measure  Calculated Column / Measure : Calculated Column  :  A calculated column is an extension of a table using a DAX formula that is evaluated for each row. If you are accustomed to using Excel, you will remember that in Excel you often need to copy a formula for each cell of a new column, unless you format your range as a table. This results in each cell potentially having a different formula because of different cell references. When you write a calculated column formula, it is automatically applied to the whole table and evaluated individually for each row. Note: The Total summation value does not give correct values in calculated columns  Example :  Cal is Table name caluculated_Column = cal[cost]/cal[sales] caluculatedMeasure = SUM(cal[cost])/SUM(cal[sales]) Here Total sales/ Total Cost value gives 0.90 in measure 21/19 = 0.90 Where as in calculated column gives 5.00 wrong results sumx_Measure = SUM...

Publish reports Into Service

Power BI Publish reports Into Service In Order signup for Power BI Service, You need a Student or corporate account  Link To Create Power BI Service Account :  https://signup.microsoft.com/signup?sku=a403ebcc-fae0-4ca2-8c8c-7a907fd6c235&email=&ru=https%3A%2F%2Fapp.powerbi.com%3Fpbi_source%3Dweb%26redirectedFromSignup%3D1%26noSignUpCheck%3D1 Now, Open Power BI desktop and build some report Sign in Your Account Once Sign In : Publish the report into your account It asks a workspace to publish Mywoksapce is the default workspace In order to create your own workspace. We need a pro/ Premium service account Once got Published check-in service Service has 3 types of accounts : Free, Pro, and Premium Version Sign Into Service : https://powerbi.microsoft.com/en-us/landing/signin/