Power BI
Difference Between Calculated Column And Measure
Calculated Column / Measure :
Calculated Column :
A calculated column is an extension of a table using a DAX formula that is evaluated for each row.
If you are accustomed to using Excel, you will remember that in Excel you often need to copy a formula for each cell of a new column, unless you format your range as a table. This results in each cell potentially having a different formula because of different cell references. When you write a calculated column formula, it is automatically applied to the whole table and evaluated individually for each row.
Note: The Total summation value does not give correct values in calculated columns
Example :
Cal is Table name
caluculated_Column = cal[cost]/cal[sales]
caluculatedMeasure = SUM(cal[cost])/SUM(cal[sales])
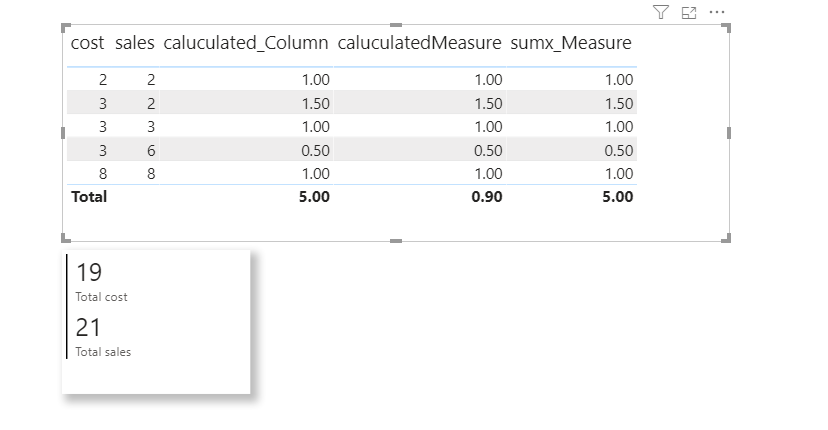
Here Total sales/ Total Cost value gives 0.90 in measure
21/19 = 0.90
Where as in calculated column gives 5.00 wrong results
sumx_Measure = SUMX(cal, cal[cost]/cal[sales])
Measures
the formula will be evaluated for each matrix row and column combination separately.
Because measures do not store their values directly in the data model, it is safe to say that they do not use any RAM for storage purposes. Instead, because they are evaluated with every interaction – for example, slicing or cross-filtering visuals – they use CPU at query time.
SUMX receives two parameters: a table to iterate on (go row by row) and a formula to evaluate for each row.
can be computed using both calculated columns and measures, while others, like margin percentage, need to be computed in measures. This may give an impression that measures are superior to calculated columns – this is not the case.
Not everything can be calculated with measures. For instance, let’s say that the Product column contains a concatenation of a brand and series: A Pro is a product of brand A, series Pro. If we want to separate brands and slice some values by brand, we have to create a calculated column because it is not possible to filter by a measure. In our case, we can use a formula like the following one:
Brand = LEFT ( Sales[Product], 1 )
This allows us to place the field in a slicer and filter by it:

The following are the reasons to use calculated columns:
Using values in a slicer, on an axis, or visual-, page-, and report-level filters, etc.
CPU-intensive calculations to pre-compute some values for a better user experience.
It is important to understand that calculated columns use RAM; the more columns you have, the bigger your data model will be.
In most cases, you can use measures, especially when you need to calculate ratios and weighted averages. Measures are evaluated at query time and mainly use CPU.
While Power BI already lets you build compelling visuals using only the fields you import from your data sources, further enriching your data model with your own calculations will make your reports infinitely more powerful.
Comments
Post a Comment