
Power BI Architecture

Power BI

Power BI Architecture :


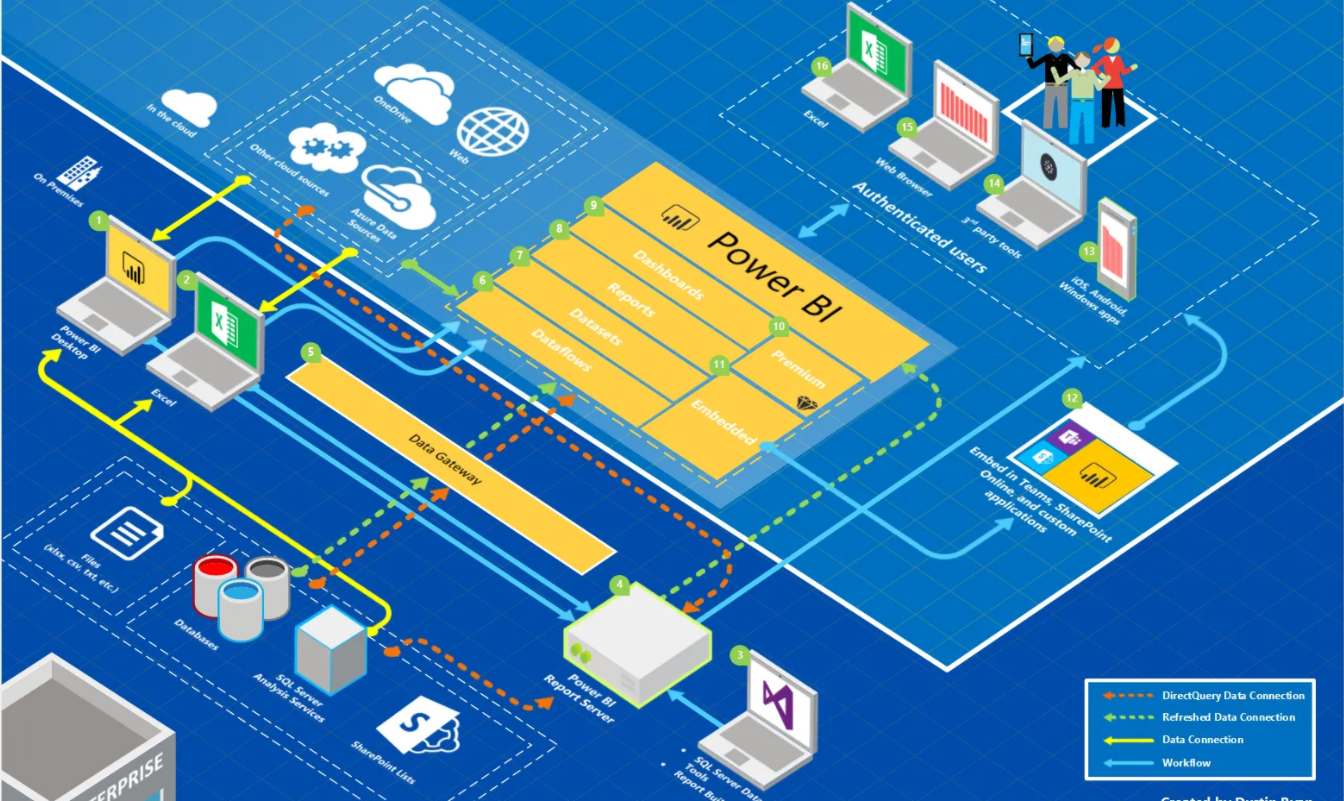
Power BI architecture has three phases. The first two phases use ETL (extract, transform, and load) process to handle the data.

  1. Data Integration: 

Data extract from different sources like databases, csv files, excel files, cloud, and different servers...etc
Then the data is integrated into a standard format and stored at a common area that's called the staging area.

  1. Data Processing: Still, the integrated data is not ready for visualization because the data needs processing before it can be presented. This data is pre-processed.
    For example, the missing values or redundant values will be removed from the data sets.
    After that, the business rules will be applied to the data, and it transforms into presentable data.
    Then this data will be loaded into the data warehouse.

  2. Data presentation: once the data is processed. We can present data in visualizations and create reports
    These visual reports help business end-users to make business decisions based on the insights.


Comments

Popular posts from this blog

Bookmarks and Buttons

Power BI   Bookmarks and Buttons Select some columns into a table : Copy Visual and Paste, change it to Bar Chart by selecting any one of the columns and overlap both visuals: Goto View → Enable selection Pane and Bookmark Pane In selection Pane, we Can hide and Display visuals Bookmarks helpful to display state of visualizations : Now, Create a bookmark : → Add Buttons   → Capture Visuvals by hiding required visuals  Now,  → Hide the Table and Off button create bookmark and capture bar chart Hide the bar chart and On Button, create bookmark and capture table Click on Bookmark1 and select the visible button and Enable action in the properties pane Type: Bookmark Bookmark: Bookmark2 Click on Bookmark2 and select the visible button and Enable action in the properties pane Type: Bookmark Bookmark: Bookmark1 Now, Ctrl+click on buttons to Capture Visuals

Connection to DB, Difference Between Direct Query and Import Mode

Power BI  Connection to DB, Difference Between Direct Query and Import Mode Goto Home → Get data → SQL Server Fill Required Fields : Click on ‘Ok’ Validate Credentials then Load the data : Difference Between Import Mode and direct Query : Import Mode : → copy of data into power bi file(PBIX) → Writing data into a file → when it is published. It doesn't require anything to pull the data into a file and it is extremely fast because it writes in a powerBI file Limits Up to the size of data - Don't Have Premium Account Import option : 1GB Limits Up to the size of data - Have Premium Account Import option : 10GB Direct Mode : Need Connection to data source every time It doesn't write data into a pbix file. Every time it reads data from the server  A little bit slow compared to import mode → when it is published. It requires Gateway Connection  to pull data into the service Dataset Limitation using direct query  1 Million Rows Limited Functionalities in Direct query wherea...

Difference Between Calculated Column And Measure

Power BI  Difference Between Calculated Column And Measure  Calculated Column / Measure : Calculated Column  :  A calculated column is an extension of a table using a DAX formula that is evaluated for each row. If you are accustomed to using Excel, you will remember that in Excel you often need to copy a formula for each cell of a new column, unless you format your range as a table. This results in each cell potentially having a different formula because of different cell references. When you write a calculated column formula, it is automatically applied to the whole table and evaluated individually for each row. Note: The Total summation value does not give correct values in calculated columns  Example :  Cal is Table name caluculated_Column = cal[cost]/cal[sales] caluculatedMeasure = SUM(cal[cost])/SUM(cal[sales]) Here Total sales/ Total Cost value gives 0.90 in measure 21/19 = 0.90 Where as in calculated column gives 5.00 wrong results sumx_Measure = SUM...